Morningstar Sustainable Investing Summit
Visualizing Climate Ratings
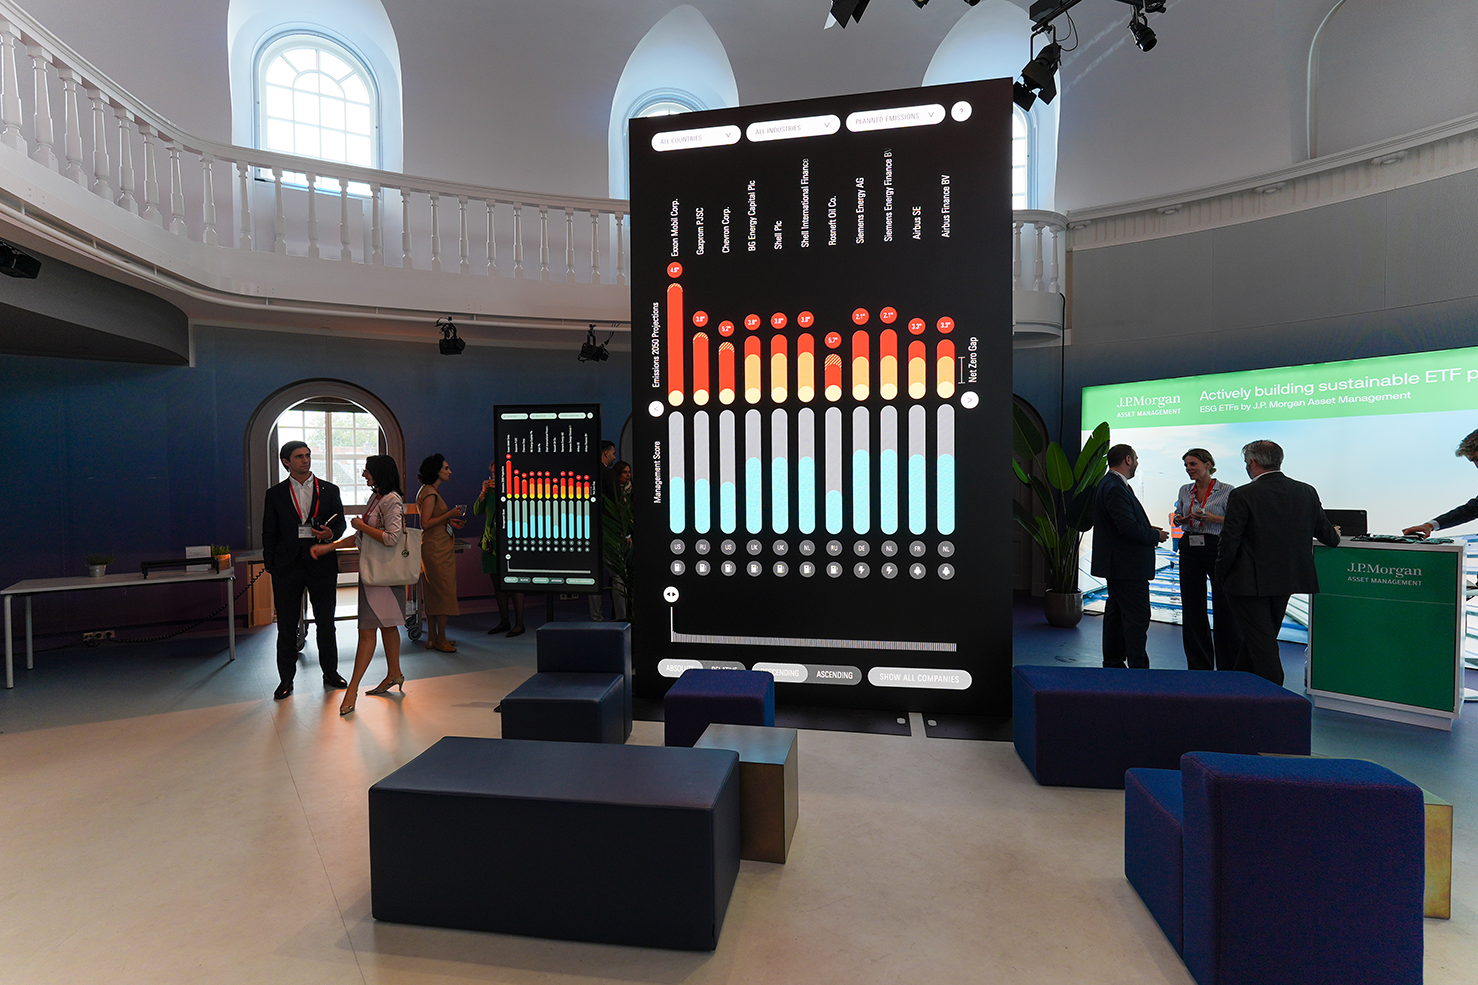
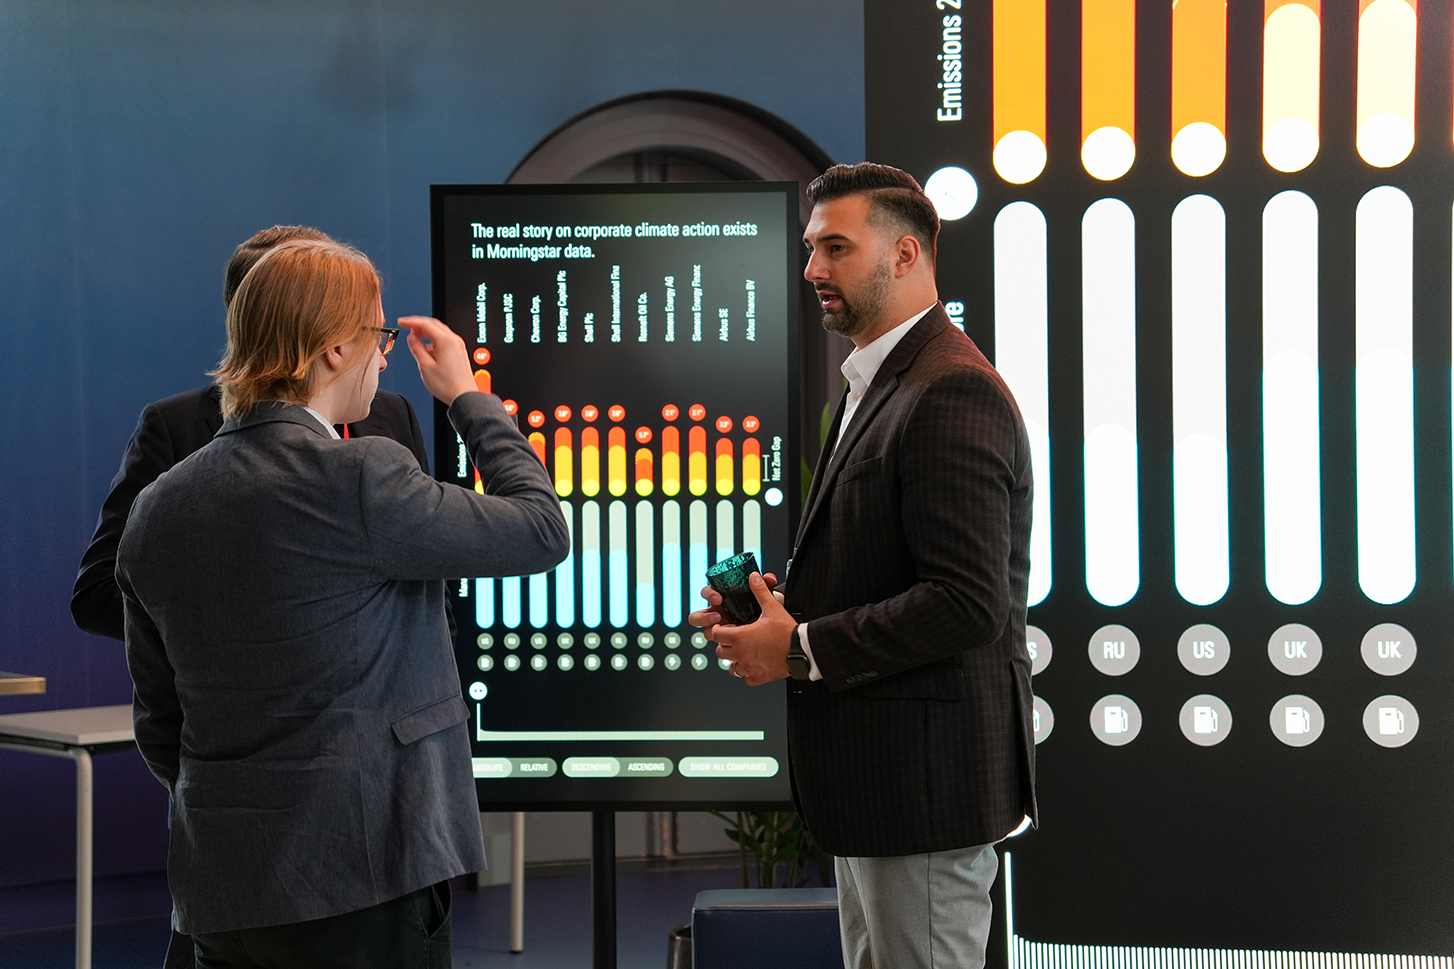
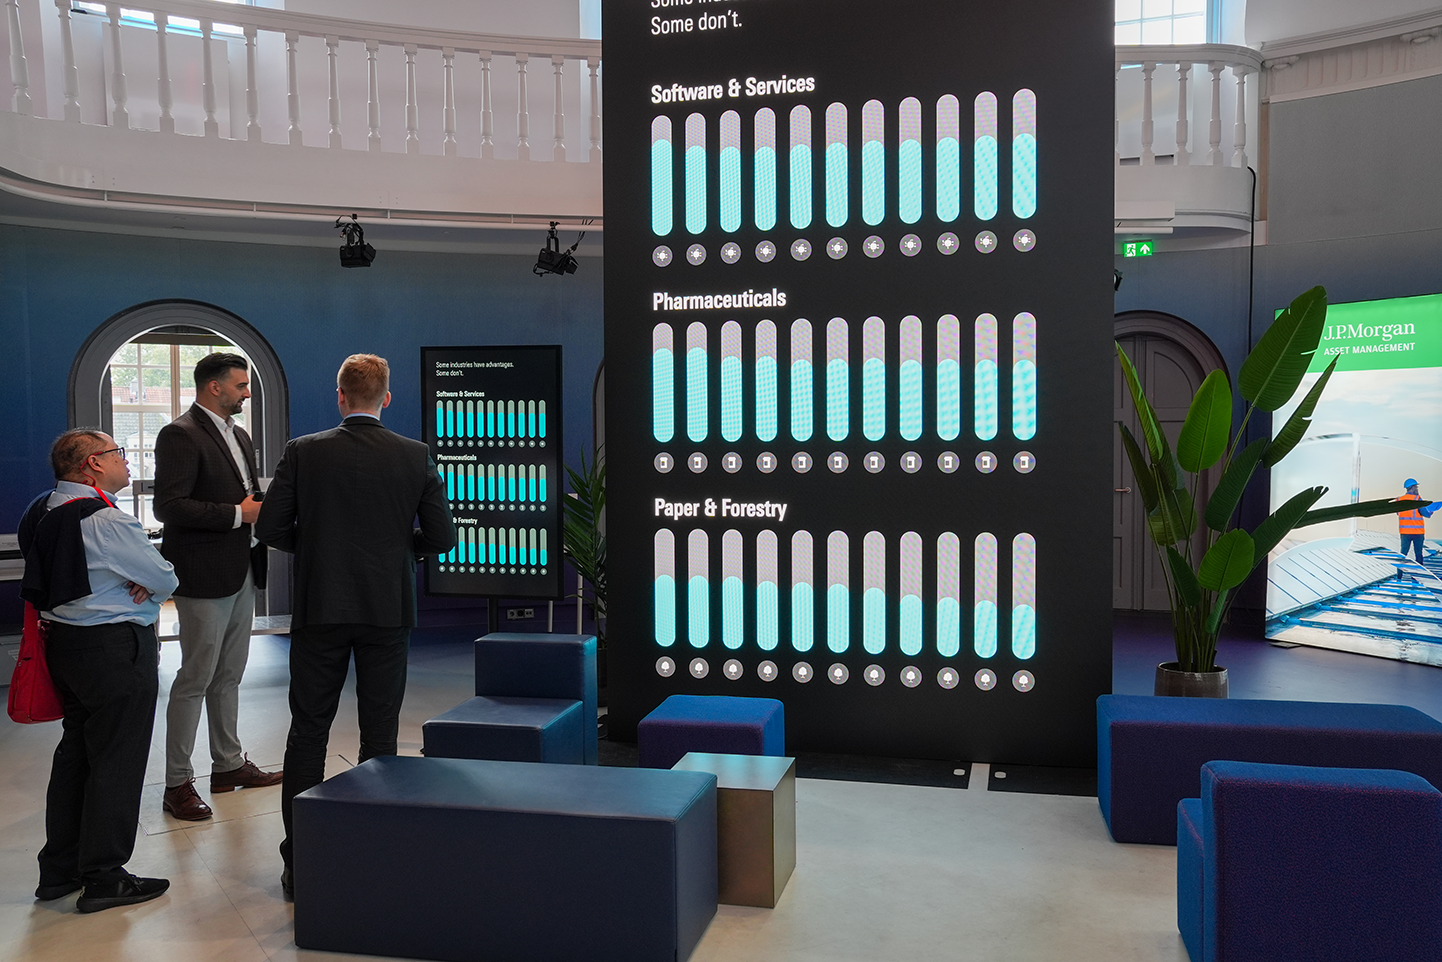
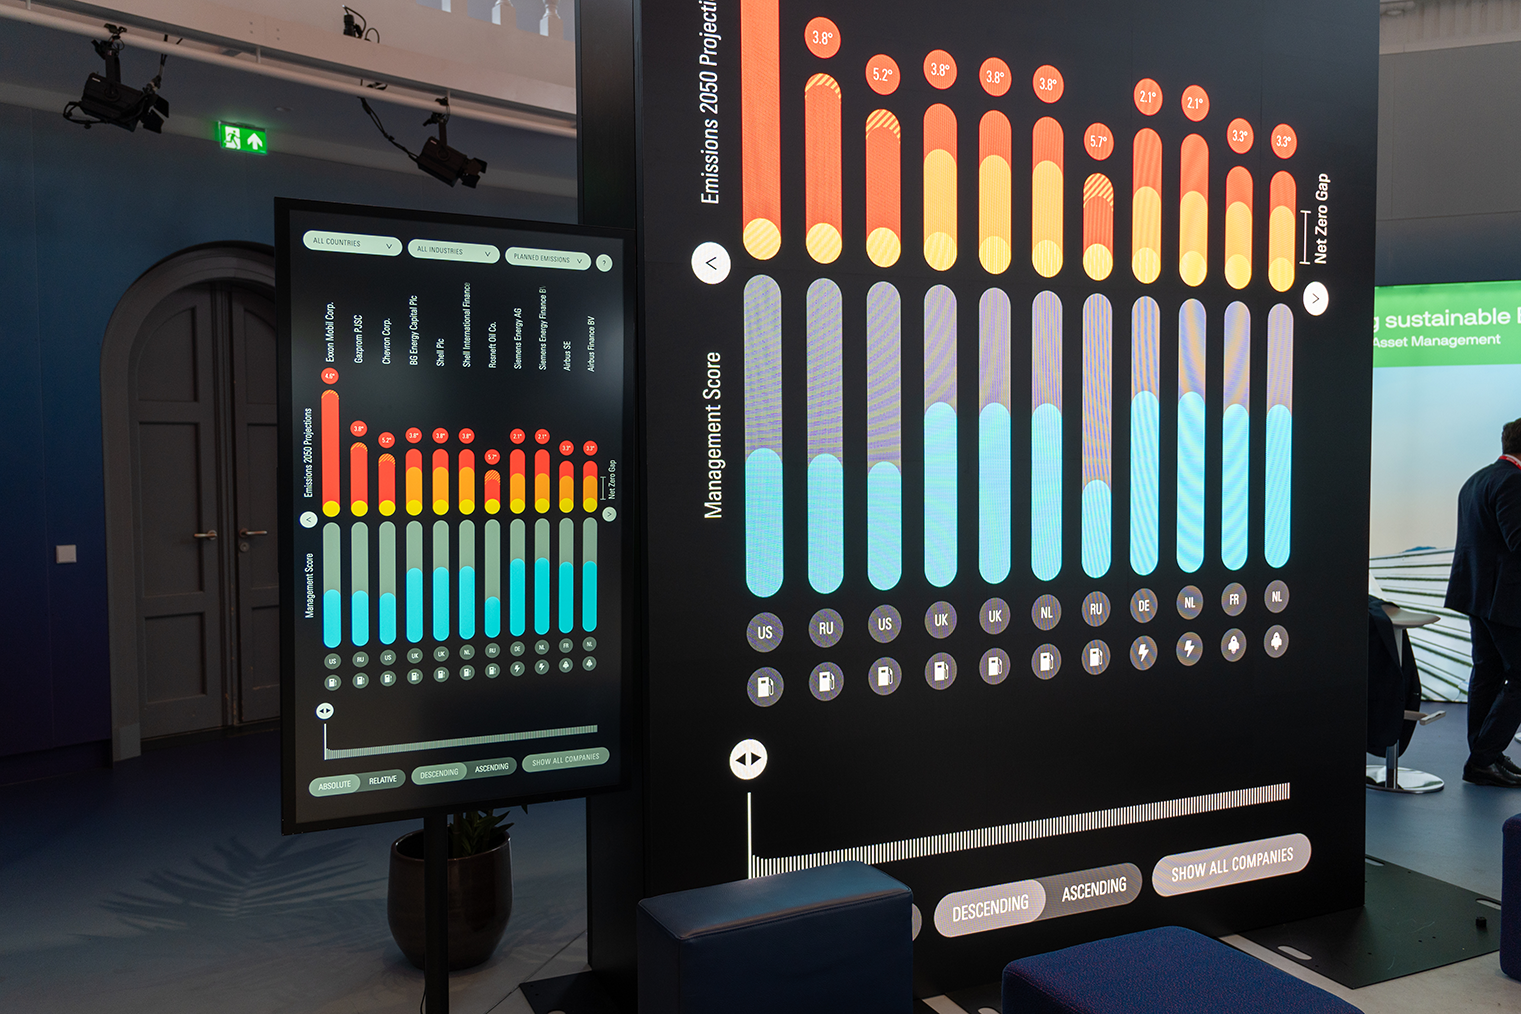
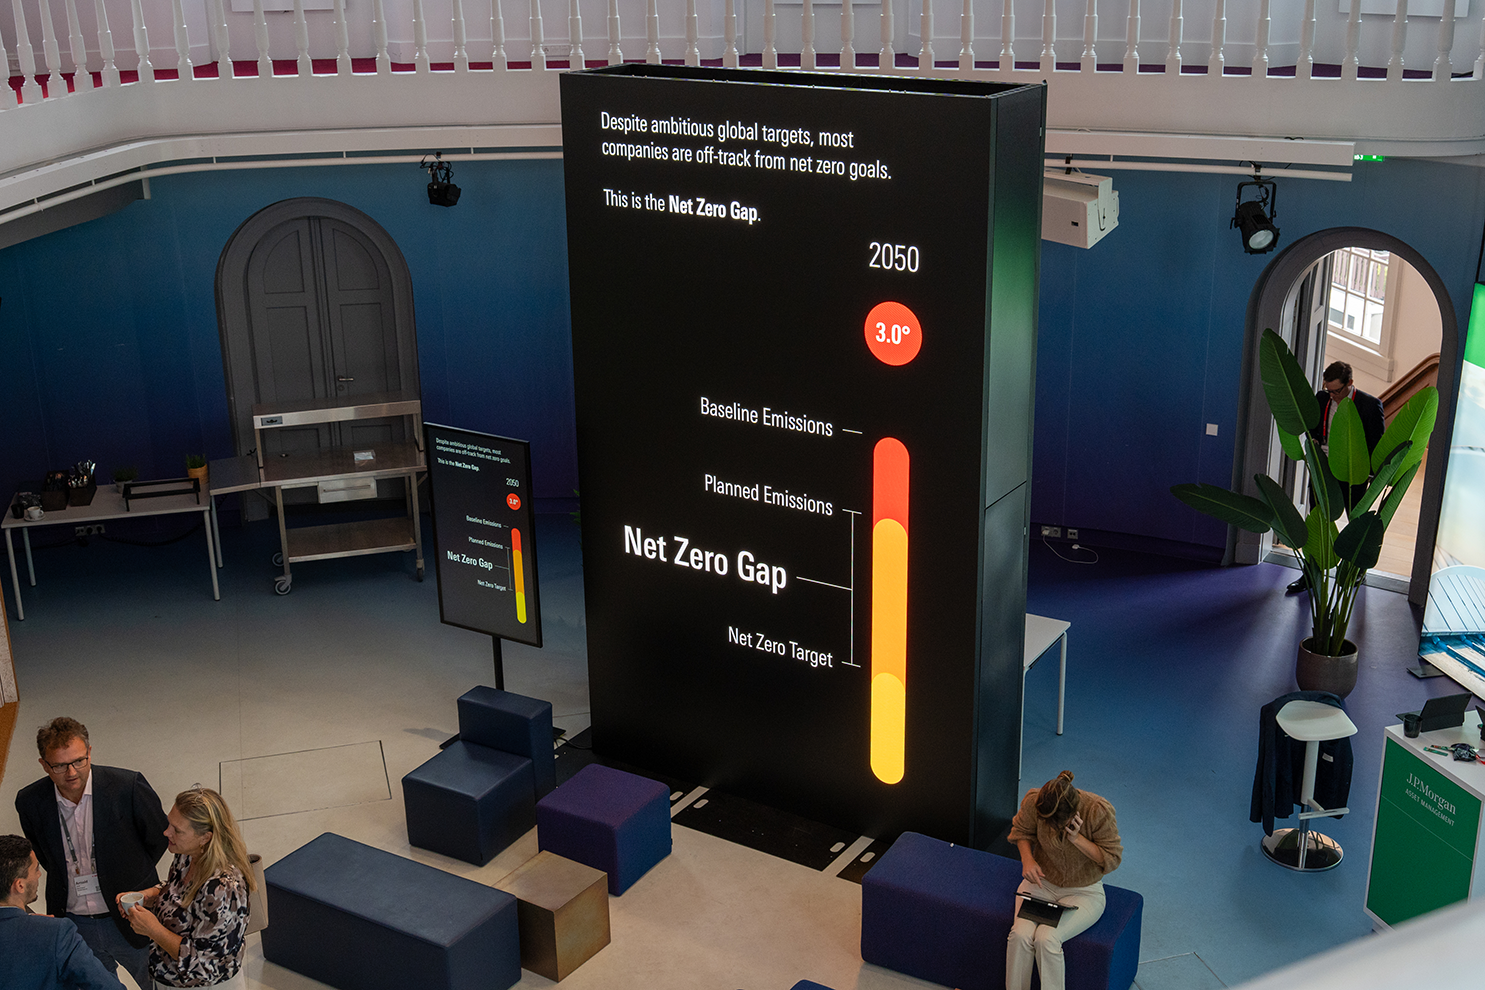
Schema envisioned, designed, and produced a large-scale interactive media installation and data visualization of Morningstar’s climate ratings for over 6,000 publicly traded companies worldwide. The visualization highlights the gap between companies’ expected / planned CO2 emissions and their net-zero targets. It was designed to display an overview of all 6,000 companies while allowing filtering based on industry and geography. Before launching into the visualization, conference attendees could watch a one minute intro animation sequence, beginning with visualizing the Earth as a blue marble, seeing the increase in temperature, and then transitioning into the climate ratings data. The installation was displayed at Morningstar’s two-day Sustainable Investing Summit at the Felix Meritis venue in Amsterdam.